ChartGen
ChartGen (https://chartgen.ai) analyzes data files and produces visualizations in the form of graphs.
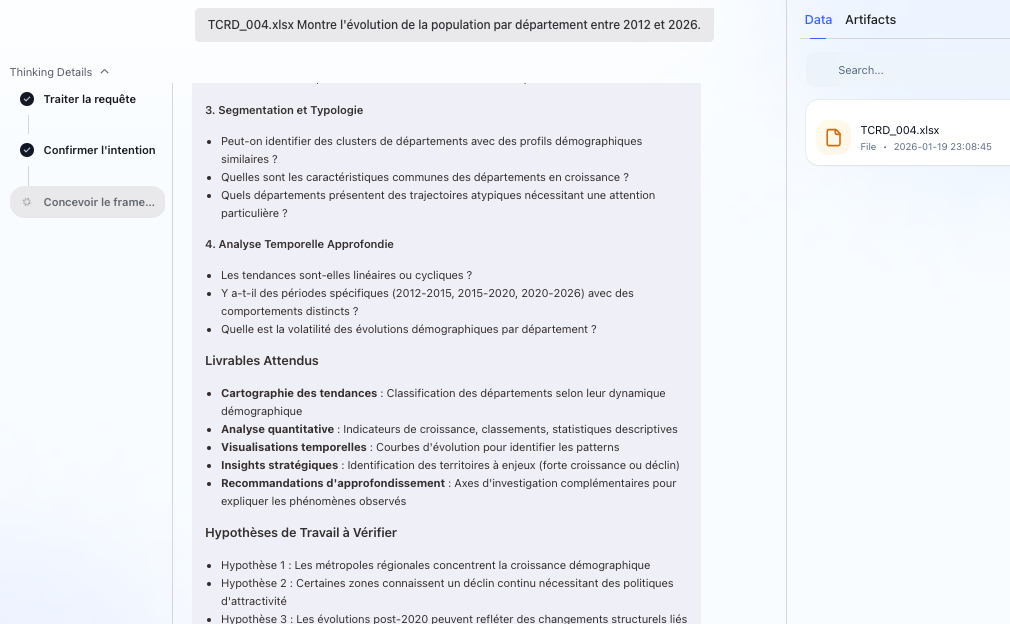
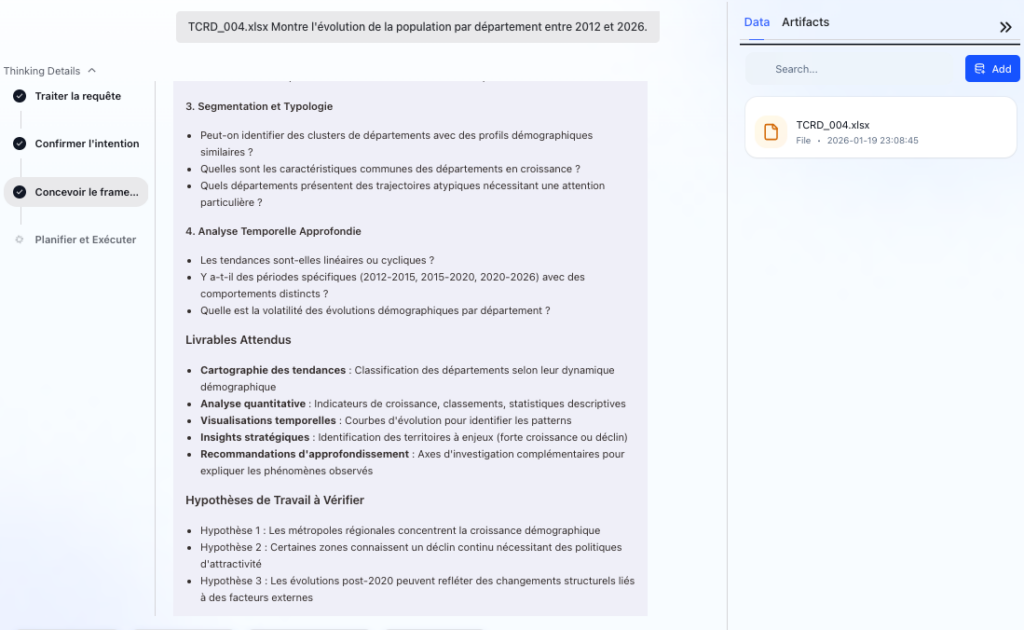
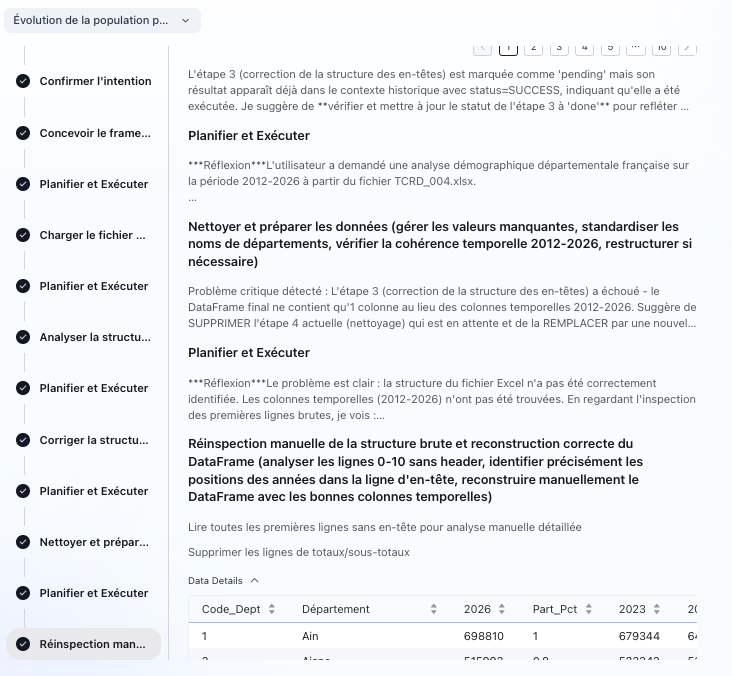
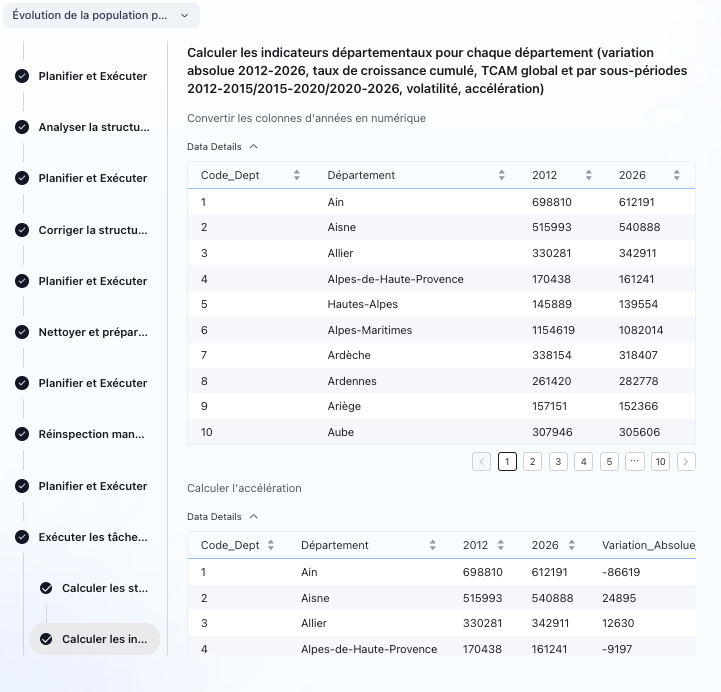
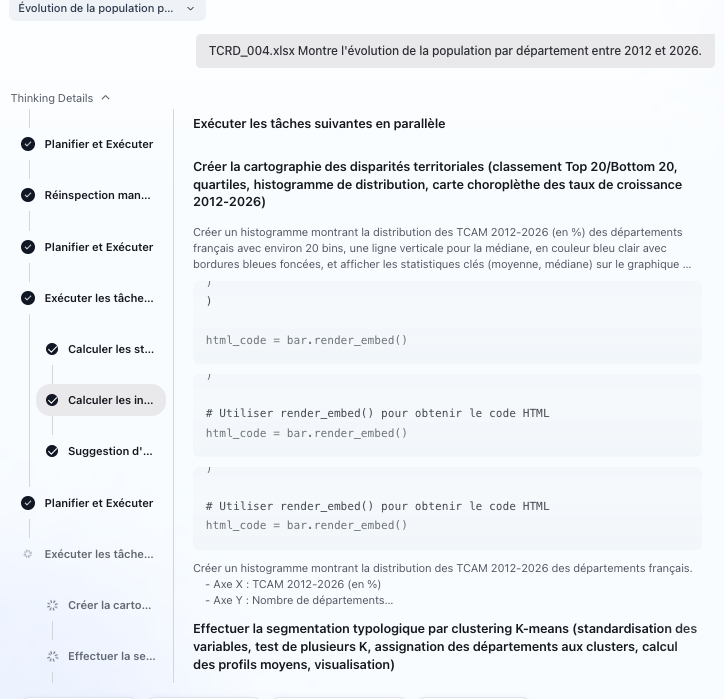
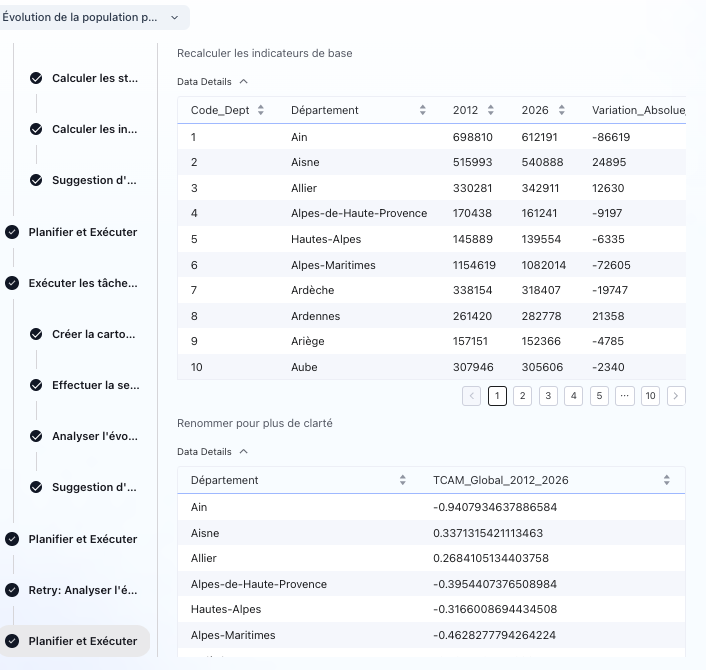
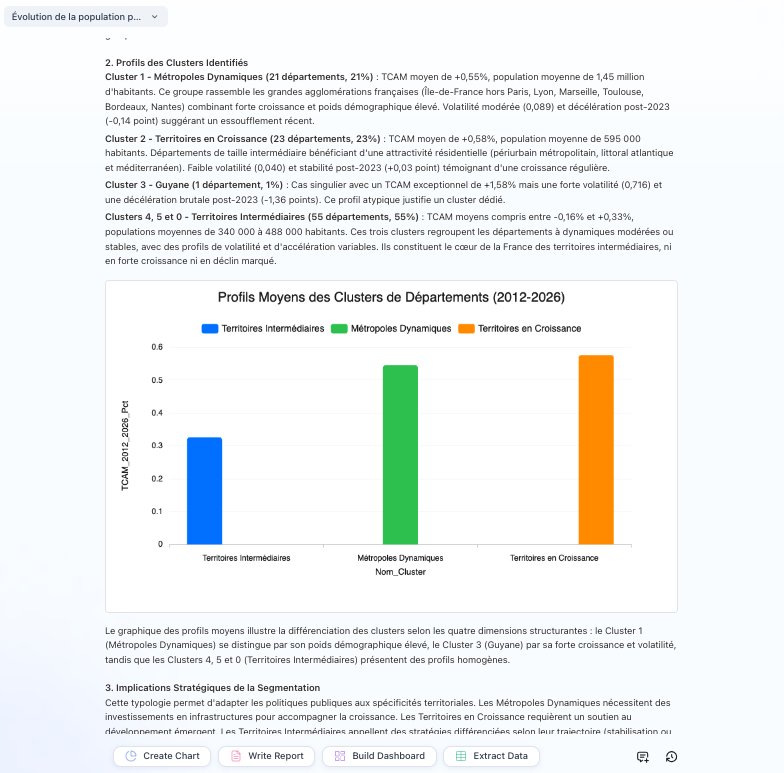
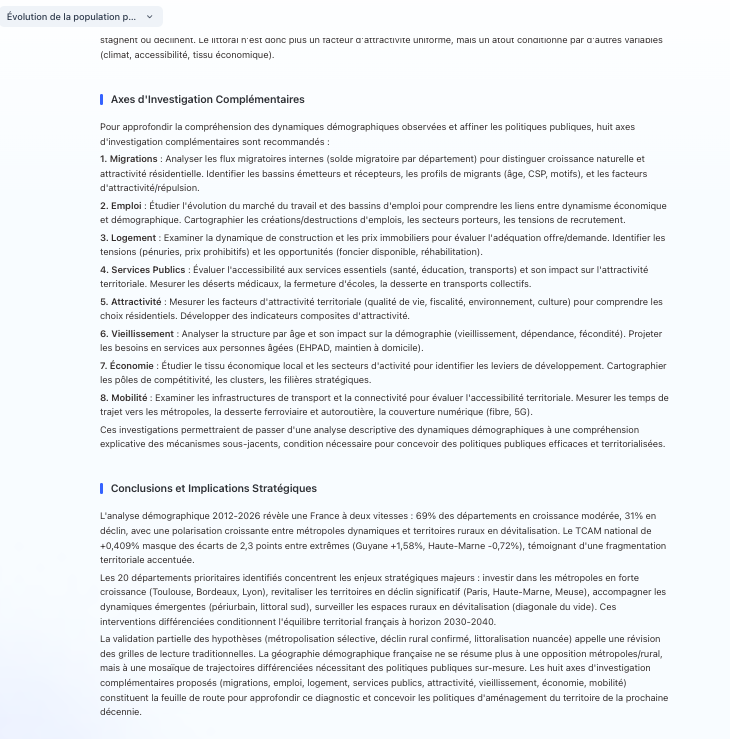
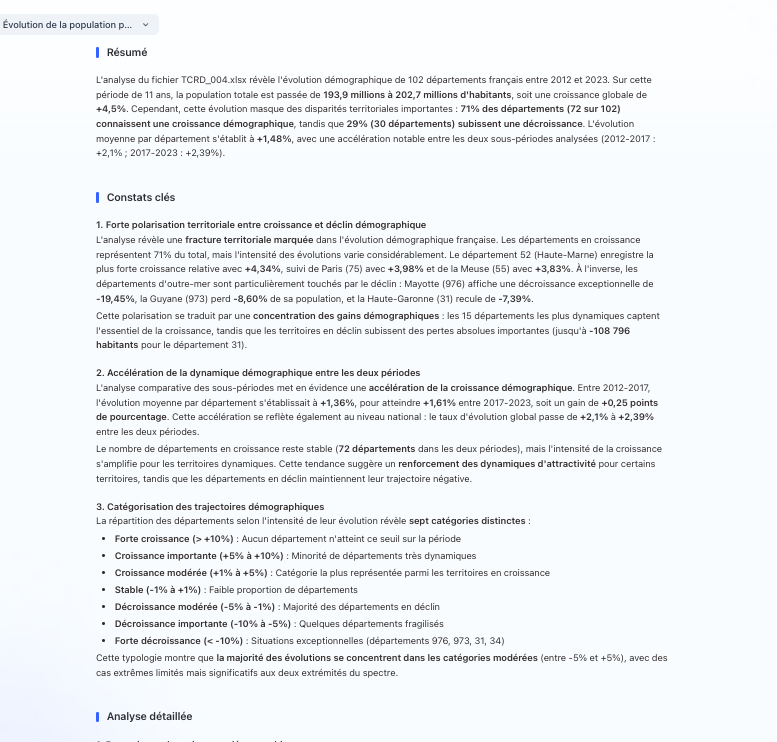
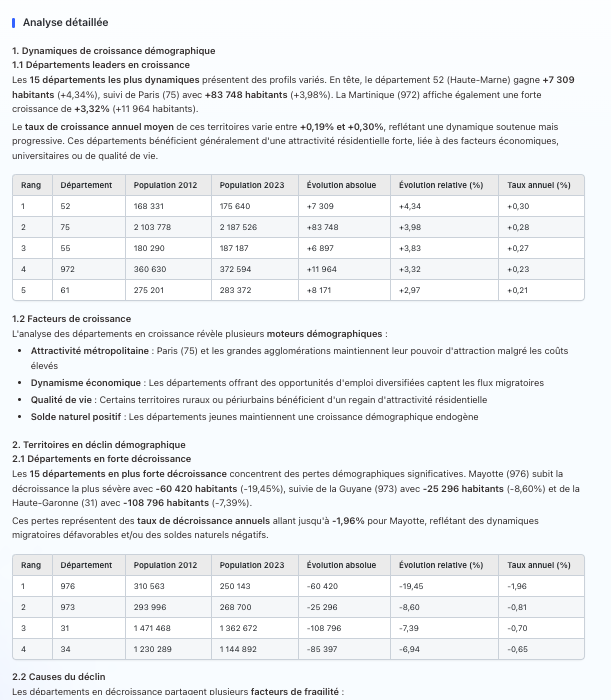
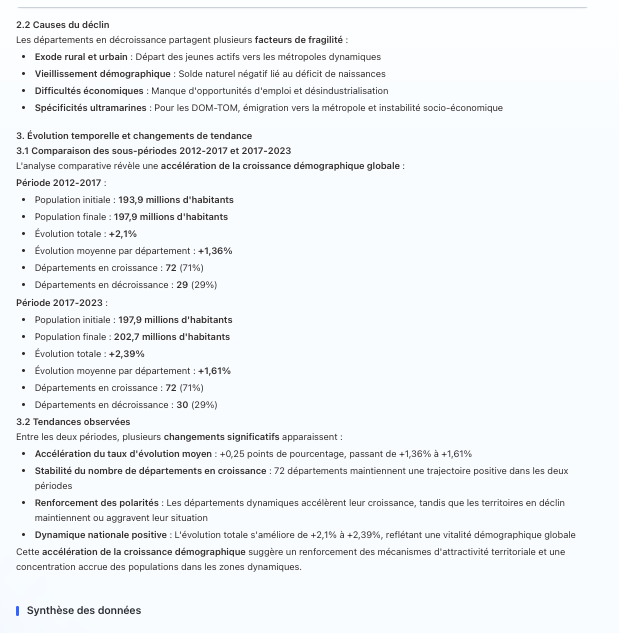
Two modes are available: “fast” and “reasoning”. The “Fast” mode proceeds directly to the analysis, the “reasoning” mode analyzes the file, provides avenues for exploitation, produces new tables as needed and offers avenues for in-depth analysis.
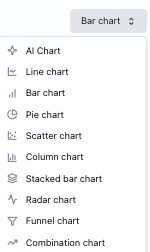
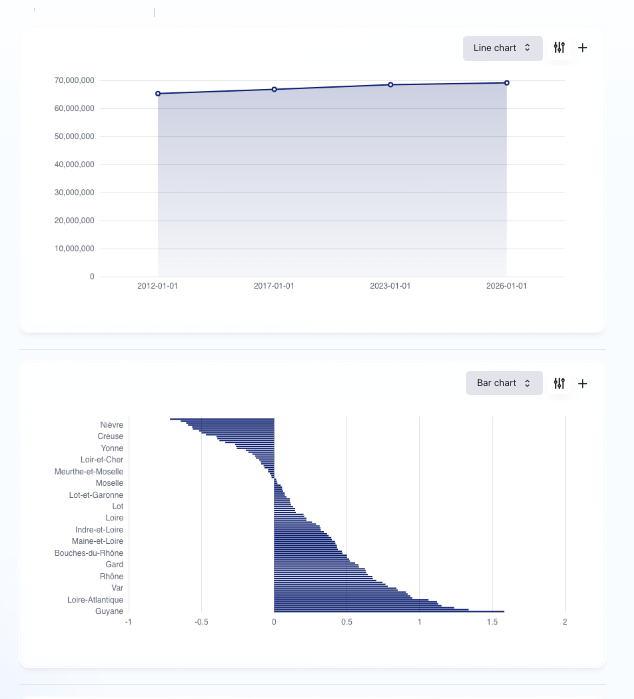
9 viewing types available.
Editing of the graphs proposed.
Export in various formats with ppt, pdf, HTML etc.
200 free credits per month, consumption according to the requests expressed.
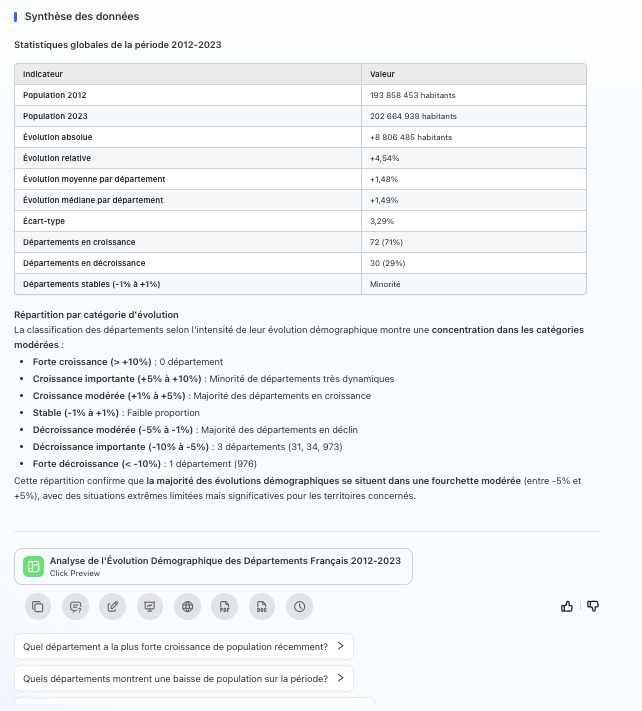
Testing since https://www.insee.fr/fr/statistiques/2012713#tableau-TCRD_004_tab1_departements
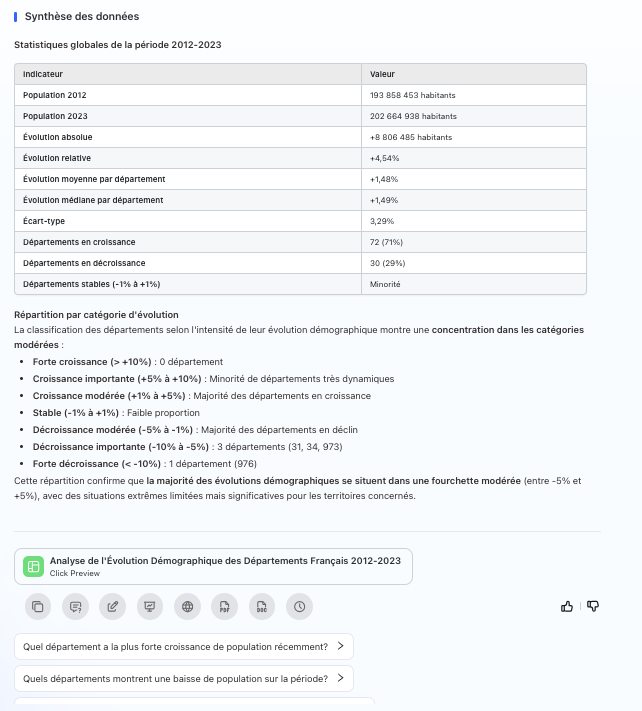
Mode Fast
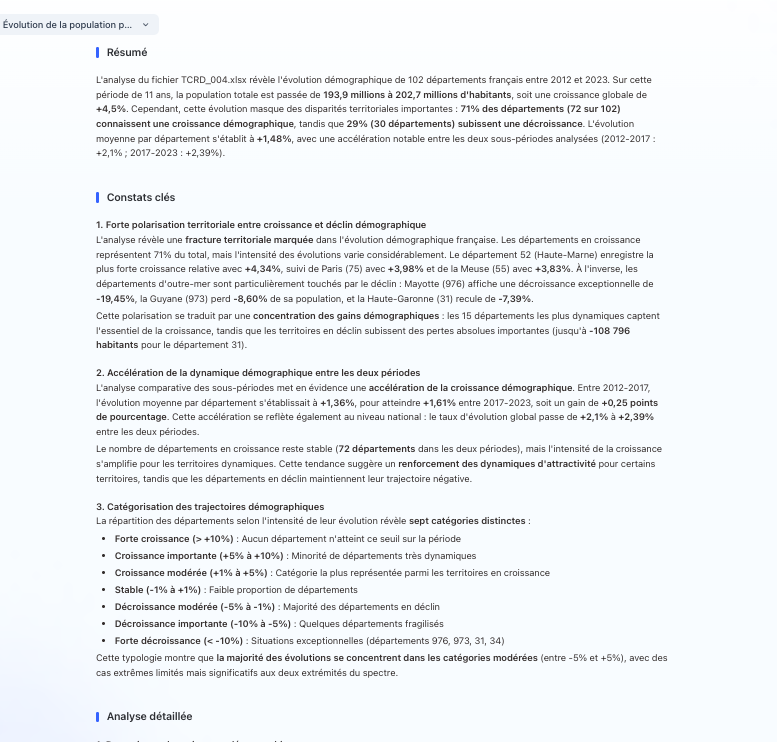
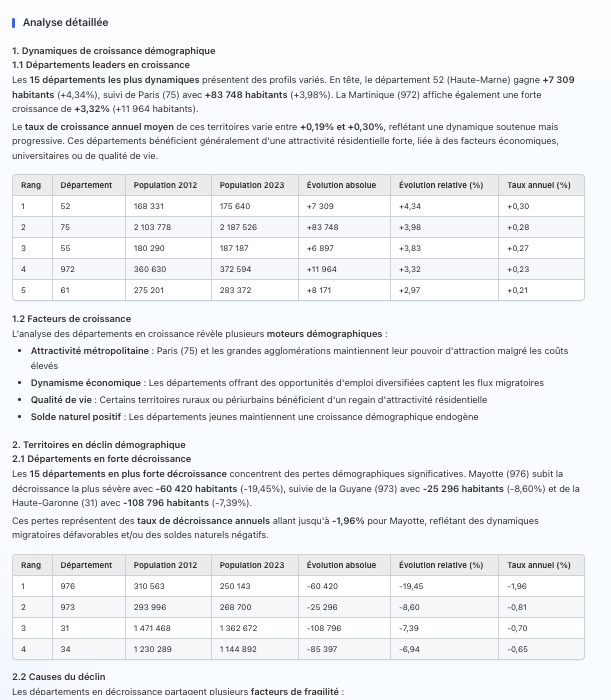
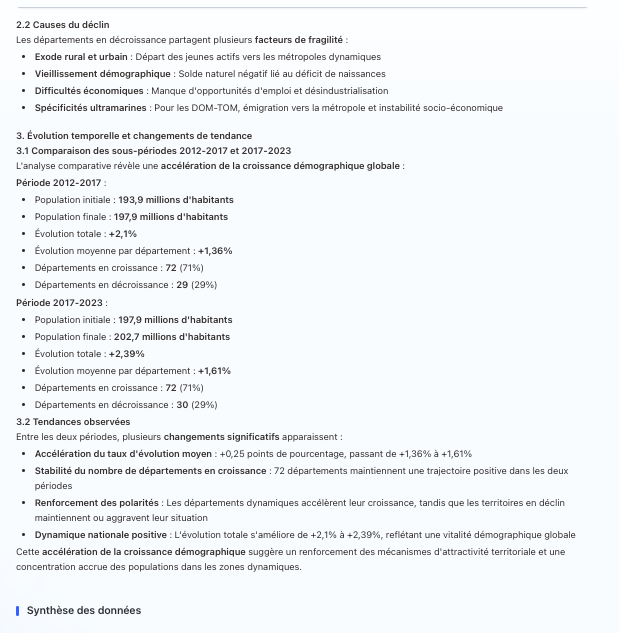
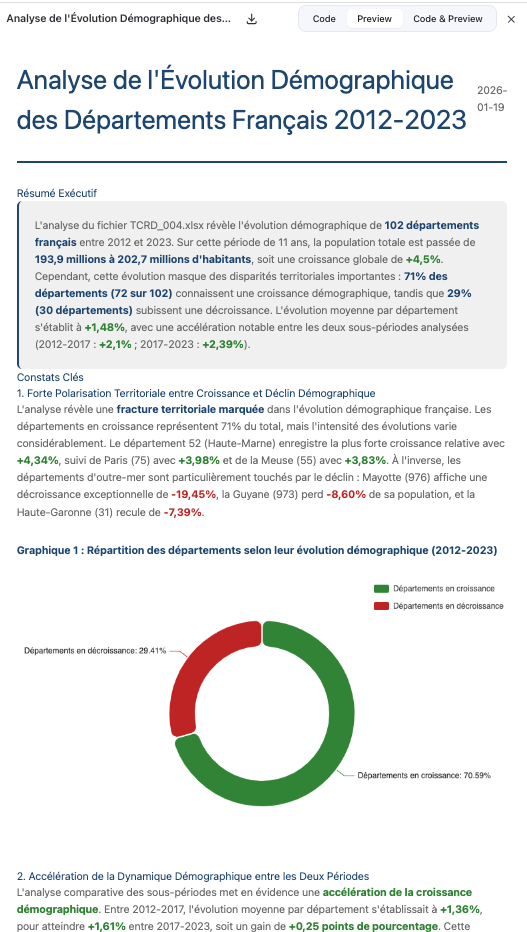
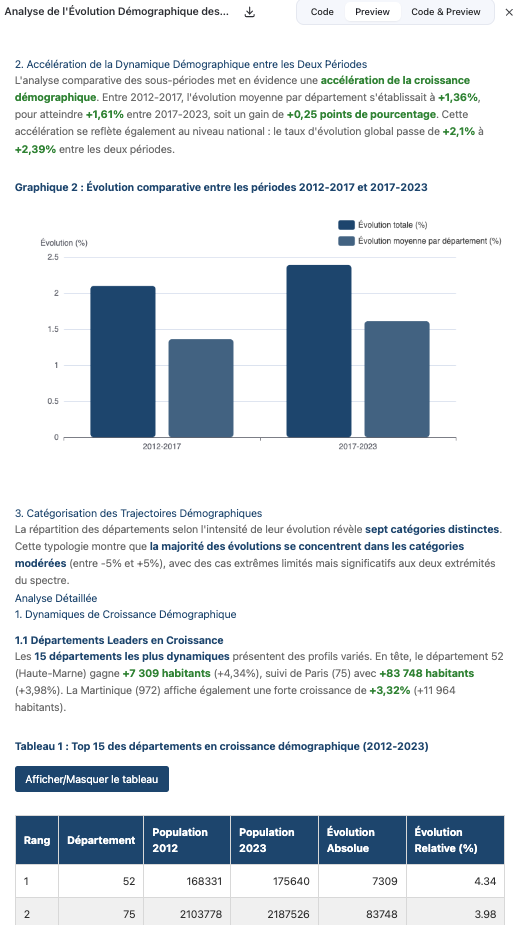
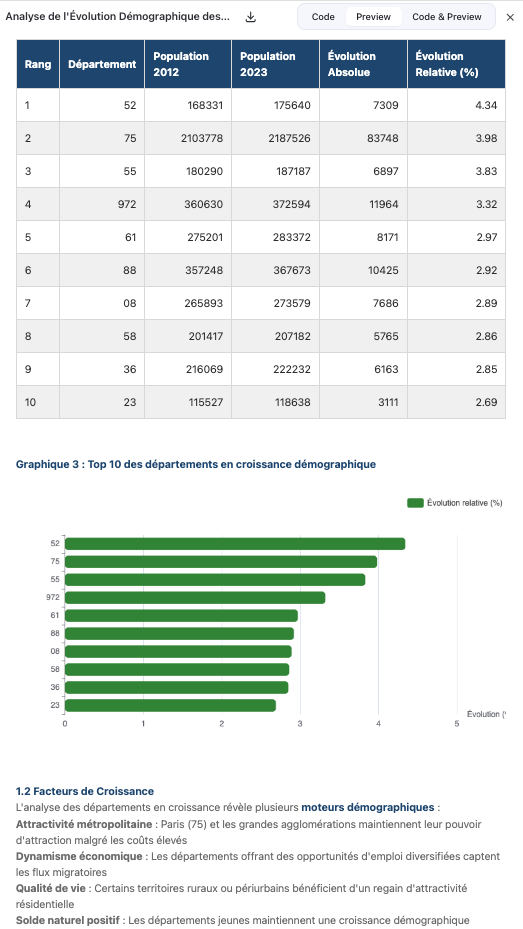
Reasoning mode
D'autres outils qui pourraient vous intéresser

Une IA par jour, une lettre d'info par semaine
uneIAparjour.fr c'est chaque jour une nouvelle application d'IA générative et une lettre d'info hebdomadaire avec les applications de la semaine, un focus et des lectures partagées.
By subscribing you agree to Substack's Terms of Use, our Privacy Policy and our Information collection notice.