DashboardGPT
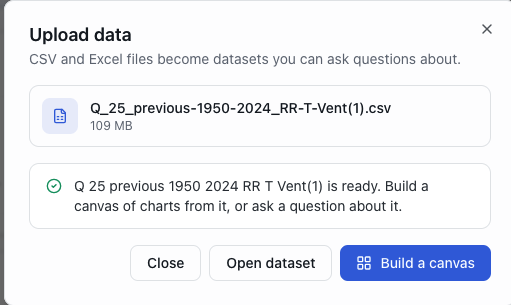
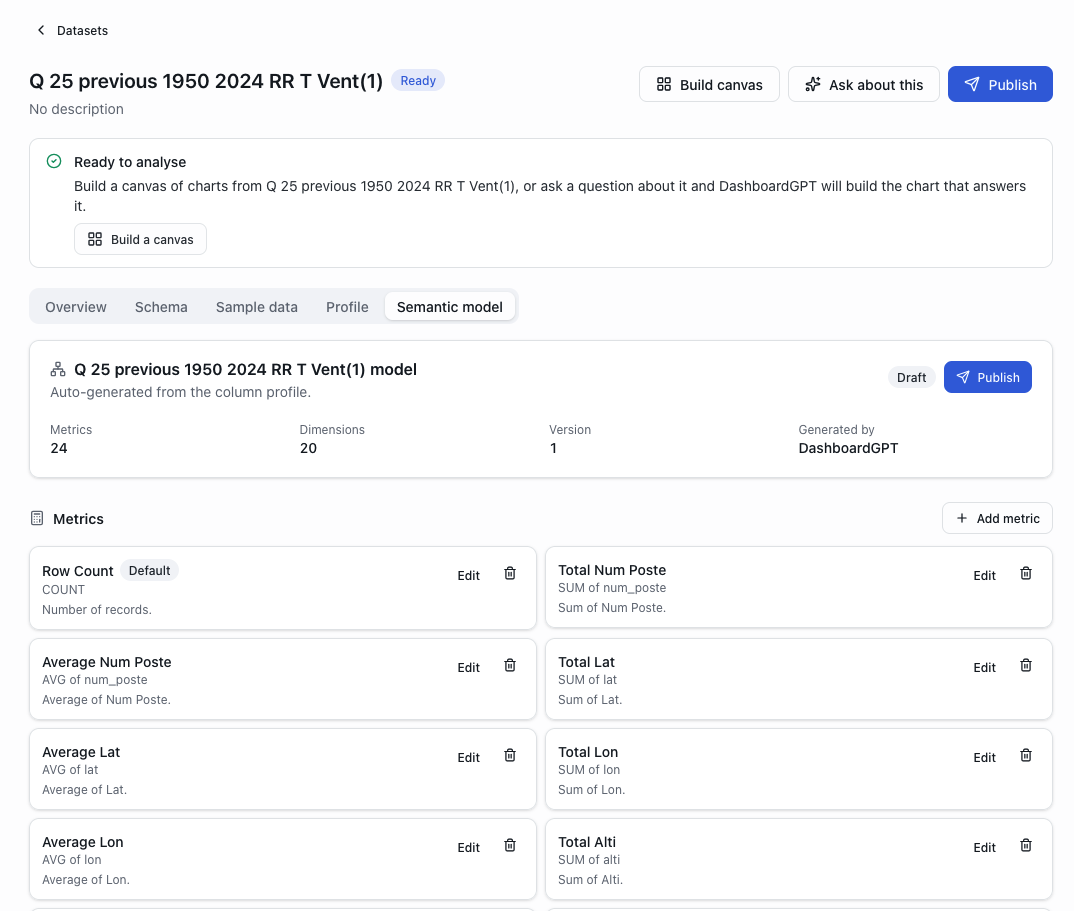
DashboardGPT (https://www.dashboardgpt.org/) analyzes a CSV or Excel file and produces graphs, indicators and written summaries.
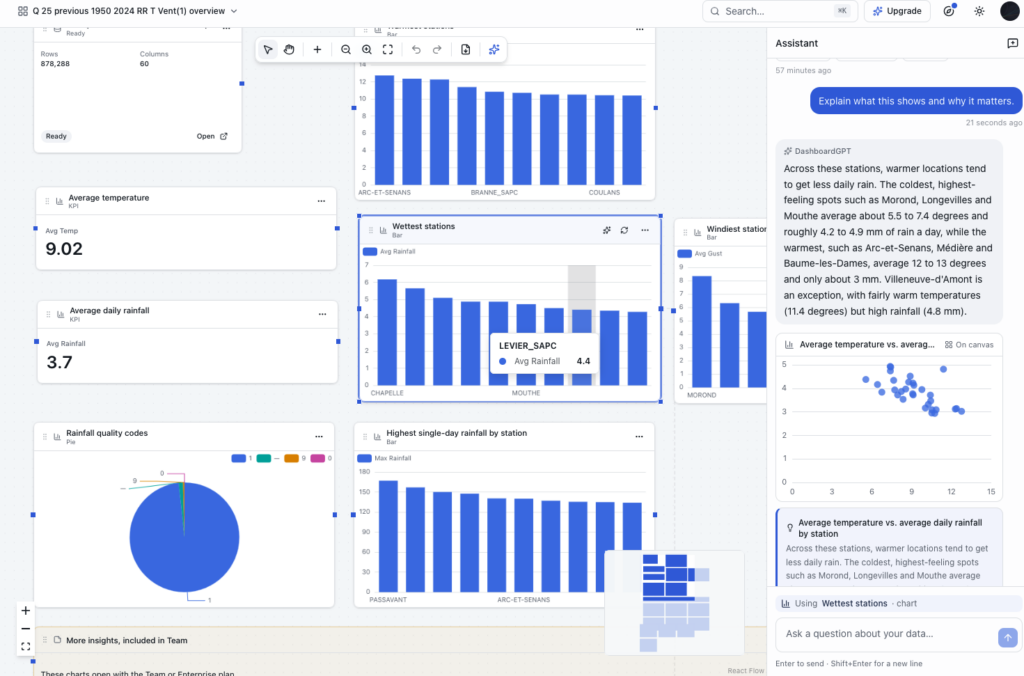
Visualizations are displayed on an infinite canvas: each element can be edited, moved, resized, or duplicated.
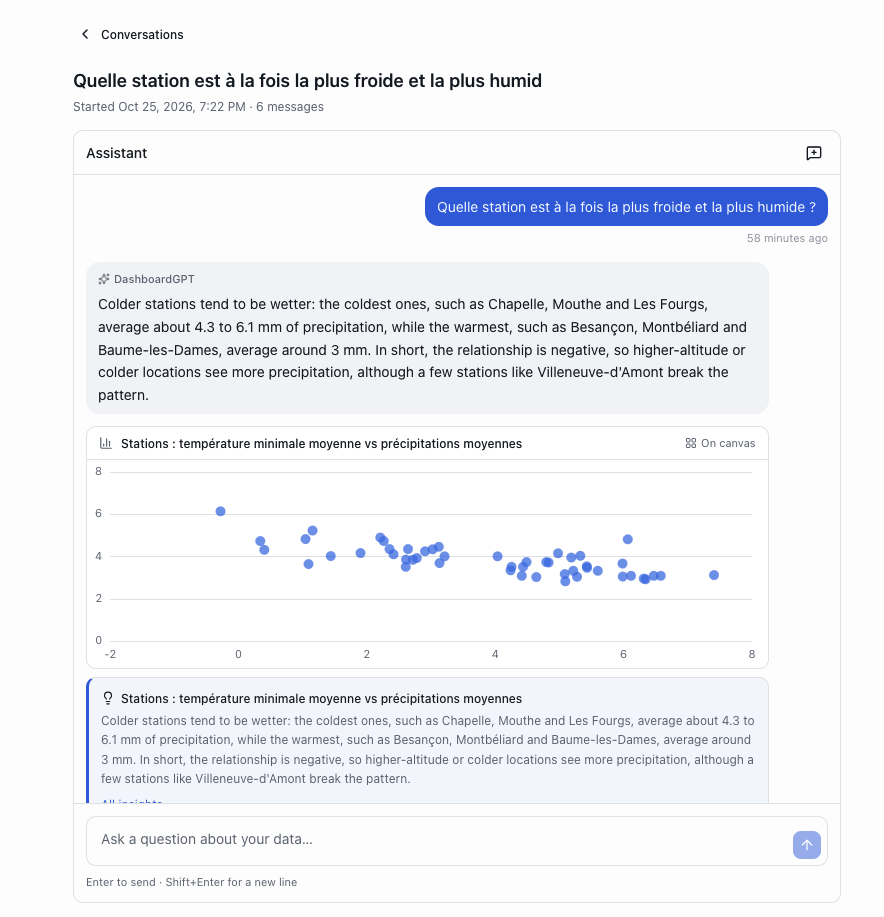
The questions in the chatbot account for selected items and active filters.
The type of visualization is changed by an instruction or directly on the element.
PDF export or share by url.
The tool does not have its own model: compatible with OpenAI, Anthropic, Azure or Google, the default AI model is not named.
Query execution relies on Apache Superset.
Note: interface and exchanges only in English, French is not supported.
Free “Explore” plan, with no time limit, with accounts: 100 queries, 25 graphs, 10 files of 10 MB, 500 MB of data processed and 5 canvases per month, for a maximum of 2 users.
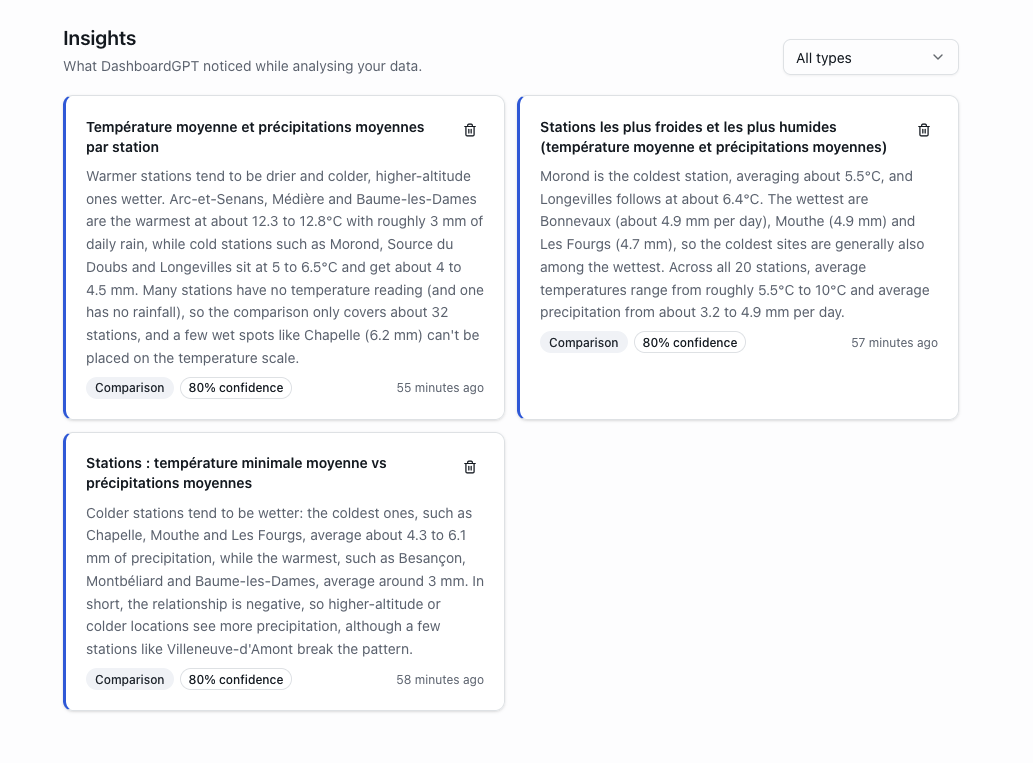
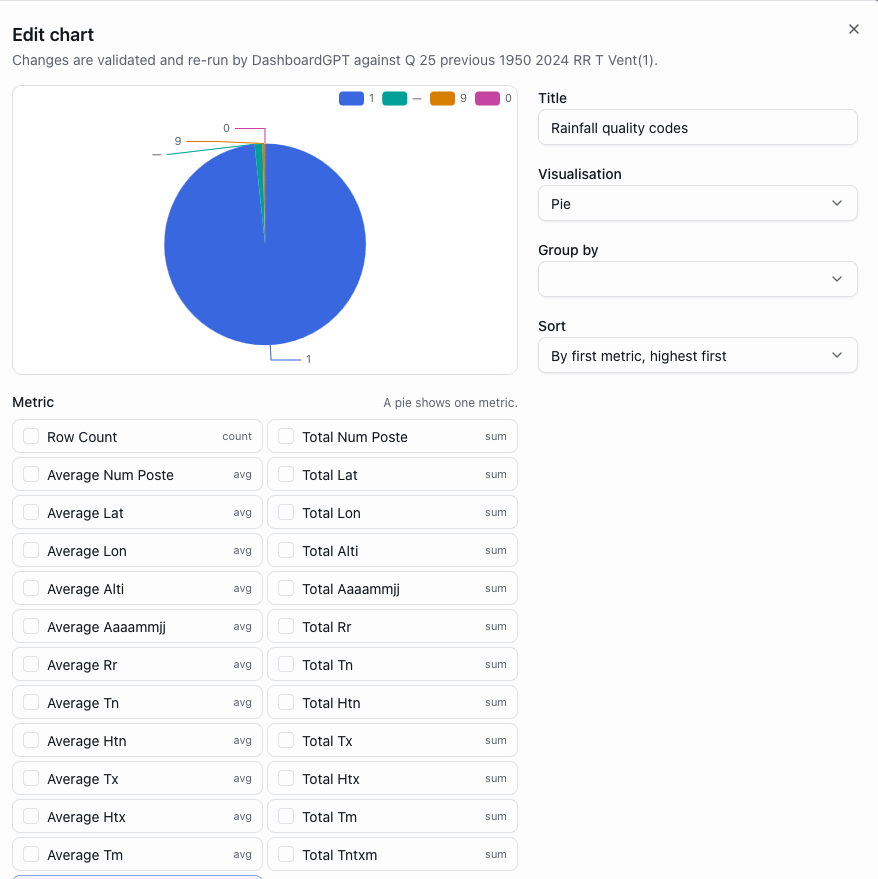
Data source: https://meteo.data.gouv.fr/datasets/6569b51ae64326786e4e8e1a
D'autres outils qui pourraient vous intéresser

Une IA par jour, une lettre d'info par semaine
uneIAparjour.fr c'est chaque jour une nouvelle application d'IA générative et une lettre d'info hebdomadaire avec les applications de la semaine, un focus et des lectures partagées.
By subscribing you agree to Substack's Terms of Use, our Privacy Policy and our Information collection notice.