Graphy
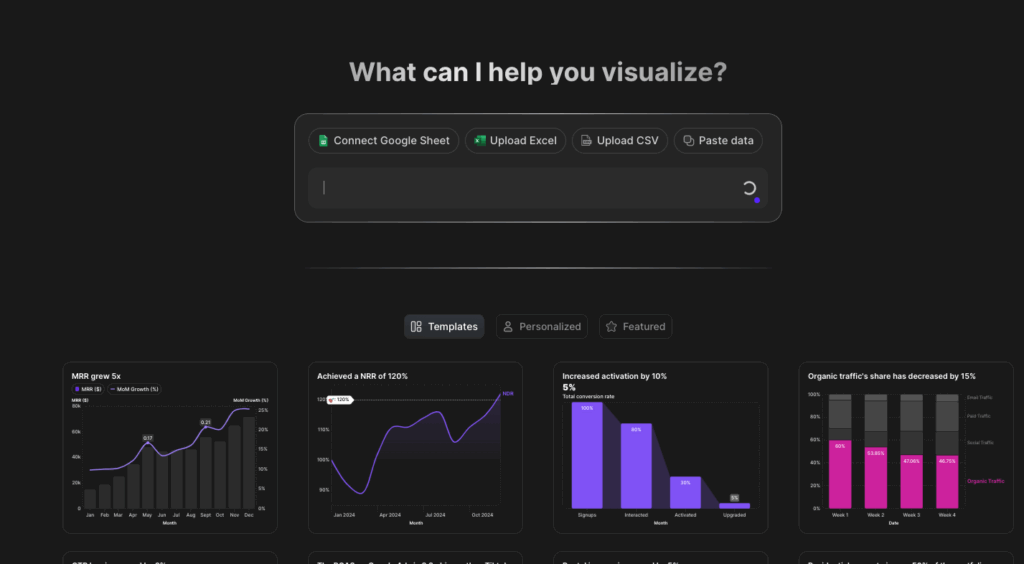
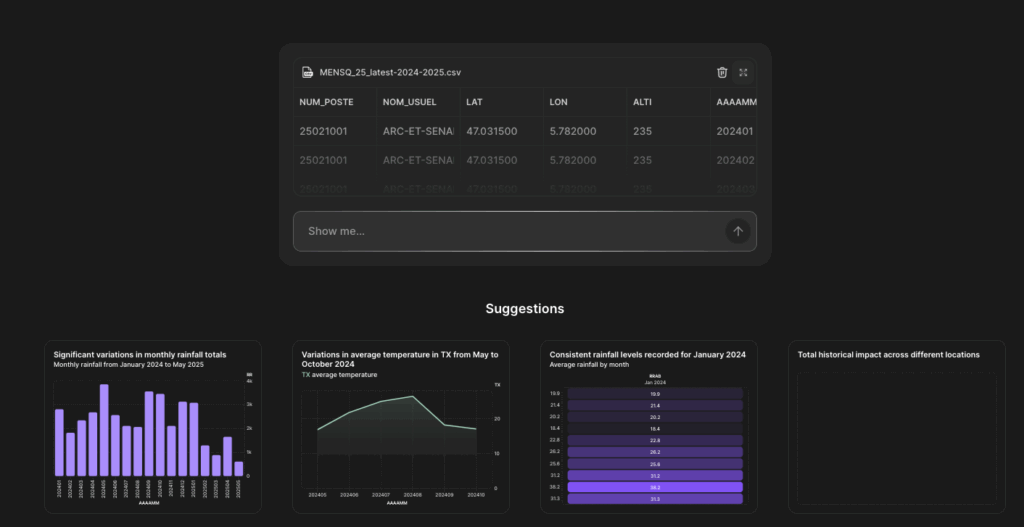
Graphy (https://graphy.app) produces visualizations from excel, google sheet, csv or pasted data files.
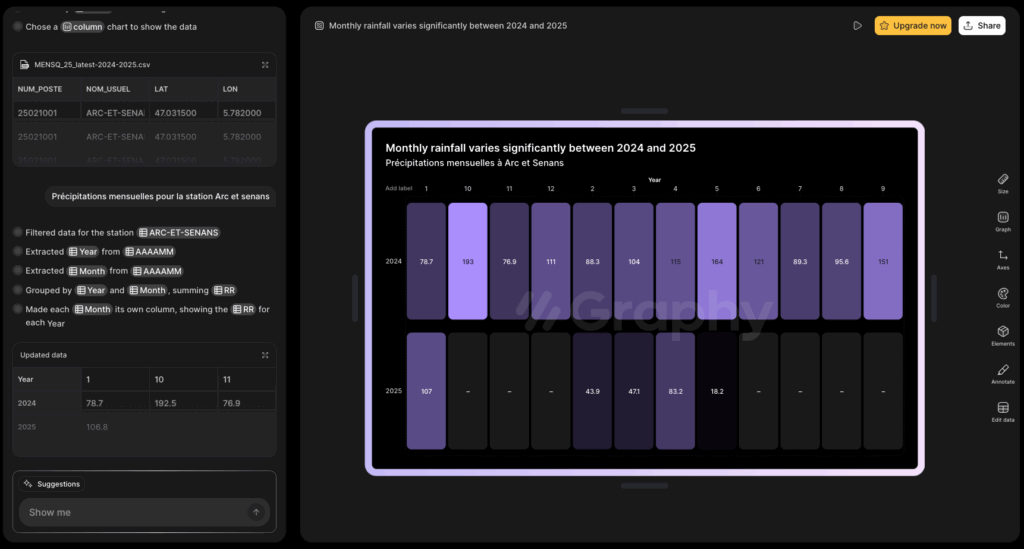
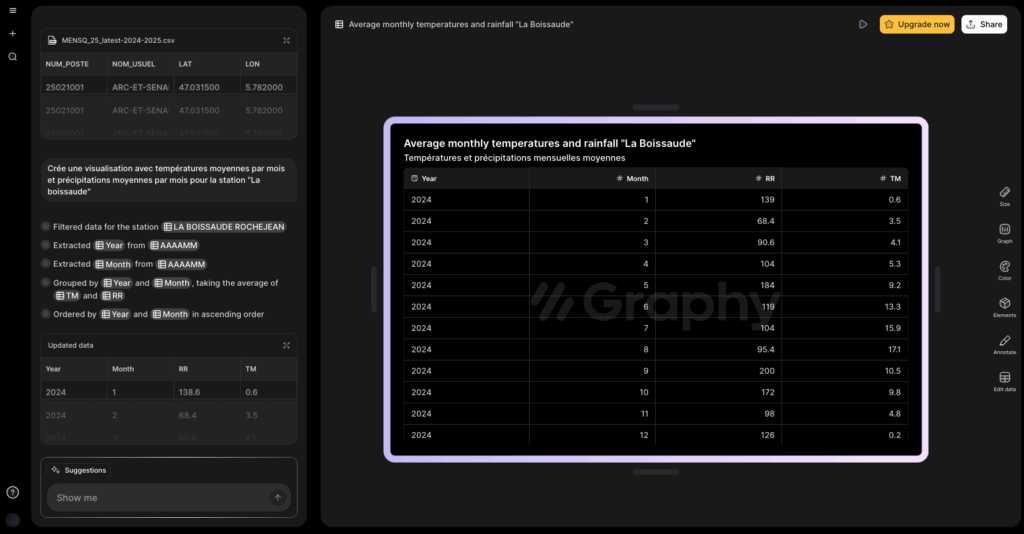
The “AI assistant” tool allows you to query the imported data so that a visualization can be generated. The visualization can be edited in detail (type, colors, format, etc.). Iterations possible.
In English with French accepted.
About twenty free queries/visualizations per day.
Data source for testing: meteo.data.gouv.fr,
https://explore.data.gouv.fr/fr/datasets/6569b3d7d193b4daf2b43edc/#/resources/5f7afd8a-5ac4-499e-bae7-3854cc580ed9

D'autres outils qui pourraient vous intéresser

Une IA par jour, une lettre d'info par semaine
uneIAparjour.fr c'est chaque jour une nouvelle application d'IA générative et une lettre d'info hebdomadaire avec les applications de la semaine, un focus et des lectures partagées.
By subscribing you agree to Substack's Terms of Use, our Privacy Policy and our Information collection notice.